-
Early Childhood Education by Television: Lessons from Sesame StreetCausality/paper 2025. 4. 21. 23:11
https://www.aeaweb.org/articles?id=10.1257/app.20170300
* Methodological paper review와 조금 다른 관점으로 review하고 있다.
* Observational study design, research flow의 감을 터득하는 것이 목적이다.
* class recommended paper list에서 하나를 골랐는데, 흥미로운 주제를 골랐다.
미취학 아동이 TV매체를 통한 교육에 노출되었을 때, 학업 및 직업 성취에 미치는 장기적 영향을 추적한다.
이 paper의 contribution은 여러 가지가 있겠지만, randomized experiment가 불가능한 상황에서, data를 세심하게 가공하여서 설득력 있는 observational study를 design하고 결과를 도출한다. cohort를 통해 long-term effect를 추적했다는 게 흥미롭다.
causal inference에 이제 막 입문한 코린이, 코알못인 내가 보아도, 좋은 논문이라고 느껴진다.
John Snow가 cholera의 원인(causes)가 오염된 물이라는 것을 밝혀내가 위해서, randomized experiment는 불가능한 대신! natural experiments (자연적으로 발생한 treatment vs. control group - 상수도 공급 업체의 일부가 상수원을 이동)을 포착하고, treatment vs control group data를 세심하게 구성하여서 covariate를 control 한 후에 diff-in-diff method로 hypothesis를 입증하였듯이
(너무 멋지지 않나요? 진정한 연구자인듯..)
본 논문도, 자연적으로 발생한 지역 별 TV 송출 차이를 포착하여서! Sesame Street program에 어느 정도 노출되었는지에 대한 treatment vs control group을 세심하게 규정하고, cohort를 추적한다. data 처리 방법이 합리적이면서도 detail하다. 그리고 역시 diff-in-diff로 causal effect를 추정한다.
(멋지다. 이런 idea는 어떻게 떠올리는 건지)
(논문 분량이 꽤 되는데, background, 세부적인 데이터 처리 내용을 파악하는 게 목적이 아니기 때문에 생략함. 주요 내용만 blog에 기록)
논문 보면서 생각한 건데, regression formula 수립하는 게 쉽지 않을 거 같다. 그리고 결과 해석이랑 (coefficient), std 도출하는 것도 쉽지 않을 것 같다. ㅜㅜ
We investigate whether preschool-age children exposed to Sesame Street when it aired in 1969 experienced improved educational and labor market outcomes. We exploit geographic variation in broadcast reception derived from technological factors, namely UHF versus VHF transmission. This variation is then related to census data on grade-for-age status, educational attainment, and labor market outcomes. The results indicate that Sesame Street improved school performance, particularly for boys. The point estimates for long-term educational and labor market outcomes are generally imprecise. (JEL I21, I26, J13, J24, L82)
In recent years, early childhood education, designed to improve subsequent life outcomes for students who participate, has received considerable attention. Programs like Perry Preschool, Head Start, universal prekindergarten, and others have taken center stage. Academic research has generally supported the role that early childhood education can play in improving outcomes for disadvantaged children, as reviewed by Duncan and Magnuson (2013), and that has led to specific proposals from those in the policy community (cf. Cascio and Schanzenbach 2014). Both sides of the political spectrum have promoted its benefits (cf. Council of Economic Advisers 2015 and Stevens 2015).
For all of this attention, it is surprising that perhaps the biggest, yet least costly, early childhood intervention, Sesame Street, has largely been left out of this policy and research conversation. This show initially aired in 1969; its fundamental goal was to reduce the educational deficits experienced by disadvantaged youth based on differences in their preschool environment. It was a smash hit immediately upon its introduction, receiving tremendous critical acclaim and huge ratings. It cost pennies on the dollar relative to other early childhood interventions. A small-scale randomized control trial (RCT) conducted at that time indicates that the show had a substantial and immediate impact on literacy and numeracy test scores at ages three and four, comparable in size to those observed in early Head Start evaluations. But, there is a lack of causal evidence about longer-term effects.
The purpose of this paper is to conduct a large-scale examination of the impact of the introduction of Sesame Street on elementary school performance, as well as on longer-term educational and labor market outcomes. There are a number of ways in which such an analysis contributes to the relevant literature and policy discussions. First, the impact of the introduction of this novel program in the United States is of interest in its own right. Second, local adaptations of this program are now broadcast in some 140 countries around the world, making the question of Sesame Street’s impact a question of current and global interest as well. Third, additional evidence on the impact of Sesame Street can also inform a discussion regarding the potential ability of television to have a positive impact on society. Typically, commentary on the role of television in society focuses on the potential for negative effects.2 Recent evidence, however, has indicated some beneficial social effects of the introduction of television (Gentzkow and Shapiro 2008, Jensen and Oster 2009). In other research, we have shown that the depiction of teen motherhood on the MTV reality TV series, 16 and Pregnant, led to a sizable reduction in teen childbearing (Kearney and Levine 2014). Sesame Street is another possible example of television that may provide social benefits in the form of improved educational performance, particularly for disadvantaged children. Whether it accomplished this is a matter of evaluating the evidence.
Our methodological approach to investigating the impact of Sesame Street’s introduction in the United States exploits limitations in television technology, which restricted access to Sesame Street to about two-thirds of the population when it first aired in 1969 (Davis 2008). 3 As we describe in more detail below, Sesame Street mainly aired on stations affiliated with the Public Broadcasting System (PBS), which often broadcast on ultra-high frequency (UHF) channels. UHF reception was inferior to reception on very high frequency (VHF) channels for physical reasons and because many television sets at that time did not have the capability to receive a UHF signal (McDowell 2006). Transmission distance also restricted access for some households. Our analysis takes advantage of the county-level variation in viewer’s ability to watch Sesame Street generated by these technological constraints that existed when the show was introduced in 1969.
We combine this geographic variation in broadcast exposure with differences across birth cohorts in terms of children’s ages at the time of the show’s introduction. Children who were already beyond first grade at the time of the show’s introduction would not have been exposed during early childhood and hence would generally not have been affected by its introduction. Essentially, we investigate whether the educational outcomes among birth cohorts who were age six and under in 1969 and who lived in locations where broadcast reception for the show was high improved relative to older cohorts and those who lived in locations with limited broadcast reception. Improved relative outcomes for the prior group would strongly suggest a causal impact of exposure to the show. We implement this approach mainly using data from the 1980, 1990, and 2000 censuses.4 We augment our main analysis with an exploration of additional data from the 1980 High School and Beyond survey.
The results of our analysis provide evidence that Sesame Street’s introduction generated a positive impact on educational outcomes through the early school years. More specifically, the point estimate implies that exposed cohorts of students with better reception capabilities were 14 percent more likely to be attending the grade that is appropriate for their age in middle and high school years. The estimated effect is large and statistically significant, but has a fairly wide confidence interval. We thus view the main takeaway to be the direction and statistical significance of the estimate effect, rather than the specific magnitude. Furthermore, the data indicate positive effects for both boys and girls, with larger point estimates for boys. The data also indicate positive effects for all three race/ethnic groups considered, with larger point estimates for blacks and Hispanics than for white non-Hispanics. In terms of longer-term outcomes, the data suggest that exposed cohorts of students are more likely to be employed and have somewhat higher wages as adults. The magnitude of the estimated wage effects are consistent with forecasts based on the estimated improvements in test scores and grade-for-age status brought about by the show’s introduction.
1. Background
A. History of Sesame Street / B. Television Technology, History of UHF
- methodological background를 소개하고 있다. Randomized experiment를 할 수는 없지만, 자연적으로 발생한 geographic gap에 의한 treatment group / control group에 대한 이야기를 하고 있다.
C. ETS Study of Sesame Street's Impact
- previous work의 limitation을 말하고, 본 연구가 previous work와 어떤 차별점을 가지는지 말한다.
Our study complements this experimental evidence by broadening the scope to the population level and considering how an entire generation of children were impacted. Although the value of randomized controlled trials is unquestioned, it is based on the behavior of a few hundred children in two specific locations. Our study applies the approach of a well-identified quasi-experiment based on hundreds of thousands of exposed cohorts of children nationwide. In addition, we consider the question of long-term outcomes. Cook et al. (1975) notes in their critique of the ETS study, “we could find no data of any reasonable quality to assess the crucial question of the long-term effects of viewing ‘Sesame Street’ on both learning and social development.” This has remained a gap in the literature, which we attempt to fill in with this paper.
2. Methods and Data
A. Overview
As described earlier, only two-thirds of households reportedly were able to receive the signal broadcasting Sesame Street when the show began in 1969. The general framework of our empirical approach is to determine the variation in “coverage” (likelihood of being able to receive the signal) across locations (counties). We then examine whether outcomes improve as coverage improves for those children who were of preschool age in 1969 relative to those who had already started school at that time. The latter group should have received little or no effect from the show. These coverage rates are largely determined by the distance to the closest television tower broadcasting Sesame Street and whether that tower transmits using UHF or VHF. Since the location of the television towers and the channel assigned to a station are functions of FCC decisions made years before Sesame Street aired, they should be unrelated to any subsequent changes in outcomes that occurred right after Sesame Street was introduced, but for the impact of the show. The remainder of this section provides the details regarding our implementation of this approach.
- target population, treatment 정의 / treatment assignment가 potential outcome과 independent함을 기술
B. Calculating Sesame Street Coverage Rates
Coverage rates을 estimate하기 위한 data procedure를 기술한다. 얼마만큼 sesame street 에 노출되었는지에 대한 명확한 정의가 쉽지 않다. (treatment) 이에 대해 어떻게 정량화하였는지에 대해 말하고 있다.


Figure 3 presents a scatter plot of the relationship between ratings and coverage. It shows that coverage and ratings are positively related; the correlation coefficient between them is 0.48. The slope also provides informative data. For every percentage point increase in coverage, ratings among 2- to 5-year-olds increase by 0.58 percent. If preschool-age children are proportionally distributed across counties, this result would suggest that over half of the children who have the technological capability to watch Sesame Street watch the show in a particular week.
It is important to note that these ratings data reflect the average number of viewers of Sesame Street over the course of a week, not overall exposure to the show. Haydon (1973) reports that over a six-week period Sesame Street attained an audience of children between the ages of 2 and 5 at “near-saturation” levels. Therefore, it would be inappropriate to use this 0.58 estimate as a scale factor to translate the intent-to-treat estimate into a treatment-on-the-treated estimate. If we were to consider “treatment” as any viewership of the show, it would be more appropriate to consider all children in an exposed area treated.
C. Empirical Specifications
Our main identification strategy relies on variation across cohorts and geography (counties) in children’s potential exposure to Sesame Street programming. We focus on cohorts born between 1959 and 1968, who ranged in age from 1 to 10 years of age when Sesame Street was introduced in 1969. Another way to think about this cohort variation in exposure to the show is that individuals born between 1959 and 1963 would have been age 6 or older, and already in elementary school at the time the show first aired. Individuals born between 1964 and 1968 would have been age 5 and below, and would have been exposed to the program during their preschool-age years. The other dimension of variation in access to the show comes from the county-level Sesame Street coverage rate, defined (as described in detail above) to be the share of television households in the county who were able to receive a signal over which Sesame Street was broadcast.
Our empirical strategy is to observe whether outcomes differ for cohorts of individuals who would have had preschool-age exposure to the show as compared to older cohorts and individuals who lived in counties with limited broadcast coverage. Any difference along these dimensions could reasonably be considered to be evidence of an impact of the show on educational outcomes. Within this framework, the specific models we estimate take the following forms:

where the dependent variable, Outcome_ijc, represents different educational and labor market outcomes for individual i, in county j, in cohort c. The subscript s indexes states. Sesame Street coverage rates, SSCov_j , are only indexed by county; that variable is time-invariant and captures the technological constraints to watching the show that existed just before it was introduced. All reported standard errors are clustered at the county level.
In equation (1), we estimate a difference-in-difference specification where β1 captures the causal effect of interest. Birth cohorts are distinguished by those who would be preschool age when the show began in the fall of 1969 ( preschool69_ic). We include county fixed effects (δ_j ) to capture time-invariant differences in outcomes across counties. We also include state × birth cohort fixed effects (γ_c × γ_s) to capture time-varying changes in outcomes across states, including state-level policy variation like the introduction of Medicaid and welfare generosity. The model also controls for a series of individual covariates, captured by X_ijc: race/ethnicity, age, and, when it is available, socioeconomic status.
The vector, Policy_jc, includes controls for two potential candidate policy changes that could lead to an omitted variable bias: a binary indicator for the introduction of the Food Stamp Program and increased expenditures on the Head Start program. The Food Stamp Program was introduced across counties in the United States between 1961 and 1975. Our model includes an indicator for having the Food Stamp Program in operation in the county in a given year, as measured by Hoynes, Schanzenbach, and Almond (2012). Our model also controls for Head Start expenditures in 1968 and 1972, as recorded by Ludwig and Miller (2007).
In equation (2), we relax the pre-assignment of treatment and control groups by cohort, allowing for the effect of Sesame Street coverage to differ by grouped birth cohorts. We aggregate individuals from neighboring birth years to increase the power of this analysis. This provides a specification check to see if the “treatment effect” really starts with the appropriate groups of birth cohorts. In both cases, we also estimate models separately by race/ethnicity and gender.
Our primary measure of interest is access to Sesame Street broadcasting, not actual viewership of the show. In this sense, our approach identifies an “intent-to-treat” relationship, not a “treatment on the treated.” If we had better ratings data, we could pursue an approach that would help us address the impact on the marginal viewer. As noted earlier, though, ratings data are only available for a limited subset of counties that are encompassed by 28 metropolitan areas.18 As a result, the question that we are best able to address with our analysis is what is the impact of making a show like Sesame Street more readily available to children, not what impact does it have on an individual child watching the show.
D. Overview of Census Data
Our main sources of individual-level data used to estimate equations (1) and (2) are microdata from the 1980, 1990, and 2000 US Census of the Population, available from IPUMS-USA (Ruggles et al. 2010). We restrict our census samples to individuals born between 1959 and 1968; these individuals would have entered first grade from around 1965 until 1974 (depending on exact birth dates and state laws regarding age of school entry), just before and after Sesame Street was introduced.
Table 1 eases the interpretation of cohorts advancing through these censuses, indicating points in the lifecycle of those in the analysis sample as they age. First, we use the 1980 census to examine elementary school performance as captured by “grade-for-age” status; this measure indicates whether a child is enrolled in school—or graduated high school for those over age 18—at a grade appropriate for his or her age. We use data on quarter of birth available in the 1980 census along with the school entry requirement laws listed in Cascio and Lewis (2006) to refine our estimates of the year students would be expected to start school. The birth cohorts in our sample would be between the ages of 12 and 21 in the 1980 census. Second, we use the 1990 census to measure ultimate educational attainment (high school dropout, high school graduation, or attended any college), as these birth cohorts would be between ages 22 and 31 in 1990 (it is not possible in the 1990 census to distinguish high school graduation from GED attainment). And third, we use the 2000 census to measure labor market outcomes (employment, hourly wage, and poverty status) when these birth cohorts would have been between the ages of 32 and 41, presumably established in the labor market, if working. In the 1990 and 2000 censuses, quarter of birth is not available so we just use age at time of census to capture cohort.
- outcome measurement 정의. 몇 가지 issue (migration, etc)를 어떻게 처리하였는지 기술.
3. Results
A. Graphical Analysis
직관적으로 파악할 수 있는 visualization 제공
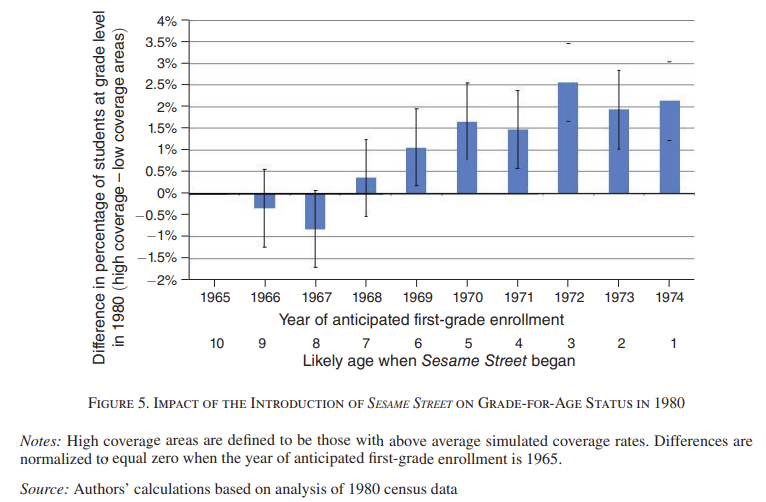
Before presenting our formal results from estimating equations (1) and (2), we first present Figure 5, which is designed to illustrate our identification strategy and guide the interpretation of our subsequent findings. For this analysis, we distinguish counties by their distance to the closest tower broadcasting Sesame Street and whether that broadcast was UHF or VHF. We define “strong reception” counties to be those within 60 miles of one of those towers and broadcasting in VHF. All other counties are defined to be “weak reception” counties because they violated at least one of those conditions. Based on our estimated coverage rates and data from the 1980 census, these categories roughly split our sample in half, with coverage rates of 83 and 55 percent, on average, in strong and weak reception counties.
We then trace out differences in our outcome measures (grade-for-age status, educational attainment, and labor market outcomes) by exact cohort between those who live in strong and weak reception areas. This approach mimics a simplified reduced-form version of the analysis we report below. Here we aggregate counties’ reception capabilities rather than use them continuously in our full econometric analysis.
Figure 5 compares grade-for-age status across these categories for several birth year cohorts. The horizontal axis is distinguished by cohort and is designed to identify those who may have been affected by Sesame Street’s introduction. In the 1980 census, quarter of birth data are available and we use that to better determine school start year. In other census years, we rely on the year a child turned age six. If Sesame Street had an effect on educational or labor market outcomes, we would expect to see the effect for the birth cohorts who started school (in the 1980 census) or turned six (in the 1990 and 2000 census) in 1970 or later. These children would have been preschool age when the show was introduced. Those who started school or were older than age six in 1968 or earlier would not have been as directly affected by its introduction, since the show targets preschool-age children and academic skills most relevant to school entry.
We view those individuals who were supposed to start school in 1969—those who were typically age six at the time—as a transitional cohort. Although a show designed to improve first-grade readiness should not have a large impact among those who were already in first grade, some children in this cohort may not have started school yet. Others may have started school, but were not doing well in first grade. Since Sesame Street was shown in most locations during after school hours, these students may have benefited from its availability as well. We do not expect any effect on them to be as large as for the younger cohorts, but we recognize the possibility of an intermediate effect.
The results of this simple analysis regarding grade-for-age status reported in Figure 5 support the hypothesized patterns. For cohorts who should have started school in 1968 and earlier, there is not a large difference in grade-for-age status between those in stronger versus weaker reception counties. For cohorts who should have started school in 1970 and later, there is a clear positive difference in rates of grade-for-age status between those in the two areas. As a whole, those in the strong reception counties are 1.5 to 2 percentage points more likely to be at the grade level appropriate for their age in 1980. Differences in grade-for-age status for the 1969 school start year cohort are positive, but smaller than those for subsequent cohorts, as expected. Overall, this figure provides evidence supportive of an effect on grade-for-age status brought about by exposure to Sesame Street.
B. Econometric Results: Grade-for-Age Status

Table 4 presents our estimation results reflecting the models represented by equations (1) and (2) above. For the full sample, from the top panel of the table, reporting results from estimating equation (1), we find that children who were preschool age in 1969 and who lived in areas with greater simulated Sesame Street coverage were statistically significantly more likely to be at the grade level appropriate for their age. To interpret the magnitude of the coefficient, we consider the impact of a 30 percentage point increase in coverage rates, which is tantamount to moving from a typical area with weak reception to an area with strong reception. The hypothetical case of moving from no coverage to complete coverage is out of sample and thus an inappropriate basis of comparison. A 30-point increase in coverage rates would generate a 3.2 percentage point (0.3 × 0.105 = 0.032) increase in the rate of grade-for-age status. With 20.3 percent of the sample behind their appropriate grade in school, this estimate implies that moving from a weak to strong reception county would lower that rate by around 16 percent.
(detailed Table 4 results analysis 생략)
causal effect estimation에 설득력을 더 하기 위한 placebo analysis & robustness check
To bolster confidence that these results in Table 4 represent a causal relationship between the introduction of Sesame Street and the outcomes of children in areas with higher rates of broadcast coverage, we estimate a placebo analysis looking at grade-for-age status in the 1970 census. To conduct this analysis, we look at students who were preschool age around 1959 (rather than around 1969). The results are reported in Table 5. Note that this essentially reproduces the exact analysis reported in Table 4, but ten years earlier. Since the show was first broadcast in 1969, it could not have had a causal effect on student school performance for students entering first grade in the late 1950s and early 1960s and if there are discernible differences in outcomes, it would suggest differential county trends that are potentially biasing the estimates in Table 4. The results of this analysis confirm that there is no discernible difference in the 1970 grade-for-age outcomes of the cohorts entering first grade just before and after 1959 in places with more or less broadcast exposure to Sesame Street after its airing. This null finding from the placebo analysis bolsters a causal interpretation of the Table 4 results.
As a robustness check, we augment the regression specification with an interaction term between the relevant cohort indicator and the series of county characteristics listed in Table 3. These “horse race” regressions are reported in Appendix Table A3. The finding of a positive effect of Sesame Street broadcast coverage on the relevant cohort is maintained across specifications, but the results do show some sensitivity. Specifically, separately adding the interaction terms between the post-1969 preschool cohort indicator and the demographic characteristics, percent female headed households and percent black somewhat attenuate the point estimate on the interaction of primary interest. Note that these are the only two characteristics that lead to this attenuation. As reported in Table 3, these county characteristics are not highly correlated with coverage rate. But, in the partial regression context, the residuals are sufficiently correlated that the inclusion of these interactions affects the point estimate on the main interaction variable. We can think of no reason why there would be a break in trend in the relative performance of school age children at precisely 1969 for counties with conditionally high rates of femaleheaded households or black households. We are inclined to view these results as spurious, but we also recognize it is important to flag this potential fragility for the reader.
C. Econometric Results: Educational Attainment and Labor Market Outcomes

We now move on to consider later life outcomes, including ultimate educational attainment and labor market outcomes. We estimate completely analogous models to those reported earlier other than changing the dependent variable and the specific census data on which we estimate the models. The measures of educational attainment (high school dropout, high school graduate, or attending any college) come from the 1990 census. Measures of labor market outcomes (log hourly wage, employment status, and poverty status) come from the 2000 census.
The results of this analysis are reported in Table 6; the top panel reports models of the form represented in equation (1) and the lower panel breaks out these effects by specific birth cohort, as described by equation (2). Estimates are reported for each educational attainment and labor market outcome for the full sample (each cell represents the results from a separate regression). The results in the first three columns regarding educational attainment provide no evidence of changes in these outcomes. Parameter estimates are small, statistically insignificant, and inconsistent with the expected pattern across cohorts (in the bottom panel).
The results in the last three columns of Table 6 regarding labor market outcomes suggest some small long-term labor market improvements. Parameter estimates all take on the expected signs: positive for employment and wages, negative for living in poverty. The estimated impact on employment is statistically significant at the 5 percent level.
The magnitude of these effects, though, is small. Our standard for interpreting magnitudes has been to evaluate the impact of moving from a weak reception county to a strong reception county, characterized by a 30 point increase in coverage. These results predict that employment would rise by about 1 percentage point (0.3 × 0.034). (0.034는 어디서 나온거지? 0.027 아닌가?)
Perhaps we should not expect to see large labor market effects driven by early childhood exposure to Sesame Street. To put these small estimated magnitudes into context, we consider what we might have expected to see given the magnitude of effects on early childhood test scores and grade-for-age status. To pursue this simulation exercise, we relate gains in test scores and grade-for-age status to wages, and then multiply this relationship by the estimated effects of Sesame Street on these two measures. Previous estimates suggest that a 0.1 standard deviation increase in reading test scores is associated with a 1.2 percent wage increase (Chetty et al. 2011). The estimates from Bogatz and Ball (1971) indicate that Sesame Street increased reading test scores of viewers by 0.36 standard deviations. Our simulation is based on a 30 percentage point increase in exposure associated with greater reception. This would generate a prediction of a 1.3 percent (0.3 × 3.6 × 1.2) increase in wages. This is actually somewhat smaller than what we observe in the wage data, but within our confidence interval.
To consider what our estimated effects on grade-for-age status would imply, we need to document the relationship between this outcome and wages. Using data from the NLSY79, we regress the natural log of wages in 2010 on grade-for-age status in 1979 among those born in 1962–1964 (who should still be in school in 1979), controlling for race/ethnicity, gender, living arrangements, and parental education. The results indicate that students who are in the appropriate grade in high school earn 27 percent more than those who are behind. Our analysis of 1980 census data, reported earlier, indicates that those in strong reception areas are 3 percentage points more likely to be in the appropriate grade relative to those in weak reception areas. This suggests we should find a 0.81 percent increase in wages associated with living in a strong reception area. This is in the same vicinity as the wage effect that we estimated.
5. Conclusion
This paper has documented the effects of exposure to Sesame Street programming content on indicators of early school performance, ultimate educational attainment, and labor market outcomes. Well-conducted randomized control trials at the time Sesame Street was initially introduced provided evidence that watching the show generated an immediate and sizable increase in test scores. Building on this existing body of early, targeted evidence, our large-scale analysis finds positive impacts on the educational performance of the generation of children who experienced their preschool years when Sesame Street was introduced in areas with greater broadcast coverage. Specifically, such children achieved relative increases in grade-for-age status. This outcome largely represents improvements in academic progress in elementary school, when students at that time were more likely to fall behind their appropriate grade level. In terms of longer-term outcomes, we see imprecisely estimated long-term effects consistent with the grade-for-age results. The positive effect of the show appears to have been particularly pronounced for boys and black, non-Hispanic children, along with those children who grew up in counties characterized by greater economic disadvantage. In that regard, Sesame Street satisfied its goal of preparing children for school entry, especially for black and disadvantaged children. Remarkably, the show accomplished that at a cost of around $5 per child per year (in today’s dollars).
'Causality > paper' 카테고리의 다른 글
Baby Bonus, Fertility, and Missing Women (0) 2025.05.08 An Exact and Robust Conformal Inference Method for Counterfactual and Synthetic Controls (0) 2025.04.27 Paper list & Other sources (0) 2025.04.21 References (0) 2025.03.04 Causal Effect Inference with Deep Latent-Variable Models (0) 2025.02.28